
Object Detection
Finding and counting the red cells, white cells and platelets in a microscope photo, on a microcontroller. Our 15,763-parameter network is built for the counting step inside a handheld blood analyzer, and the whole model fits in 23 KB of flash.
- labeled white cells found, by every one of five trained models
- 71 of 71
- red cells counted across the test photos on average, against 805 labeled
- 807
- parameters in the whole network
- 15,763
- of flash for the 8-bit model
- 23 KB
Where it's used
Counting cells right where the sample is
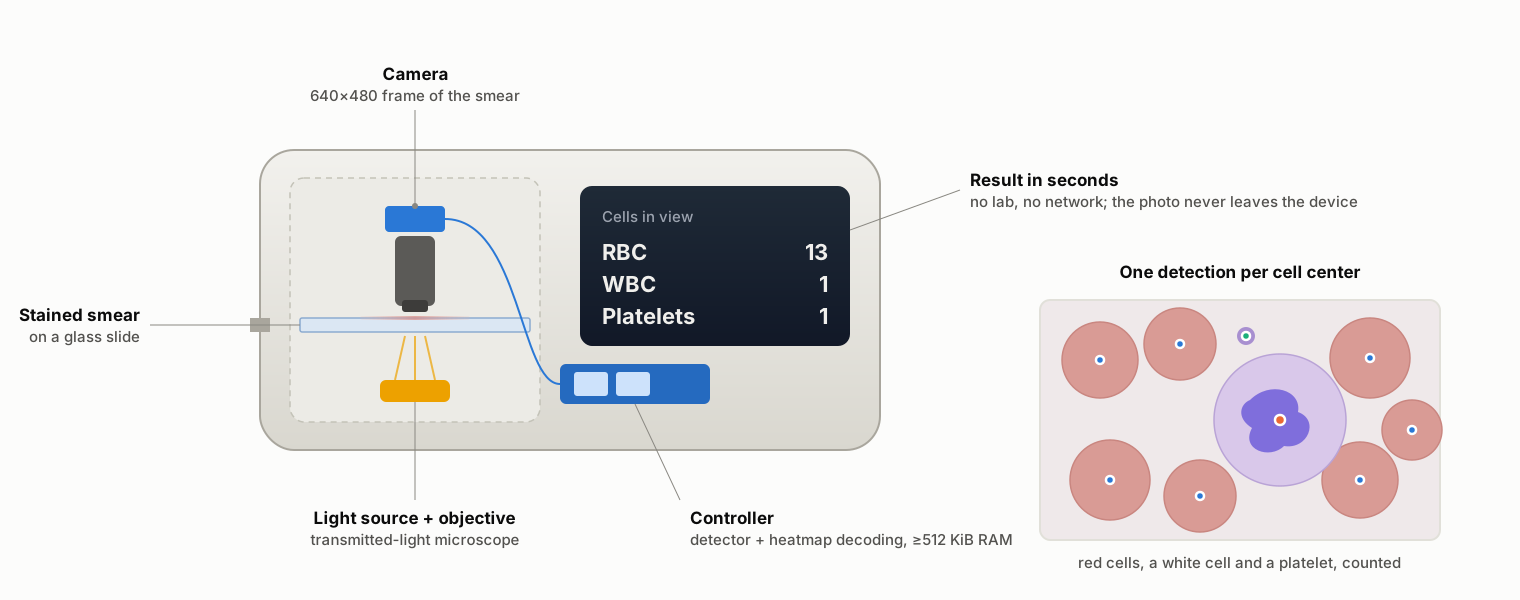
Picture a handheld blood analyzer, or a microscope camera clipped onto a phone, at a rural clinic or a field hospital. Counting the cells on the device means a result in seconds with no lab and no network connection, and a blood photo that never leaves the device.
It’s also a step up from a classifier. Instead of one answer per image, it says what’s in the frame, where it is, and how many there are. That’s object detection.
- Handheld blood analyzers
- Microscope cameras clipped onto a phone
- Rural clinics and field hospitals with no lab
- A patient's blood photo that never leaves the device
The data
364 labeled blood smear photos
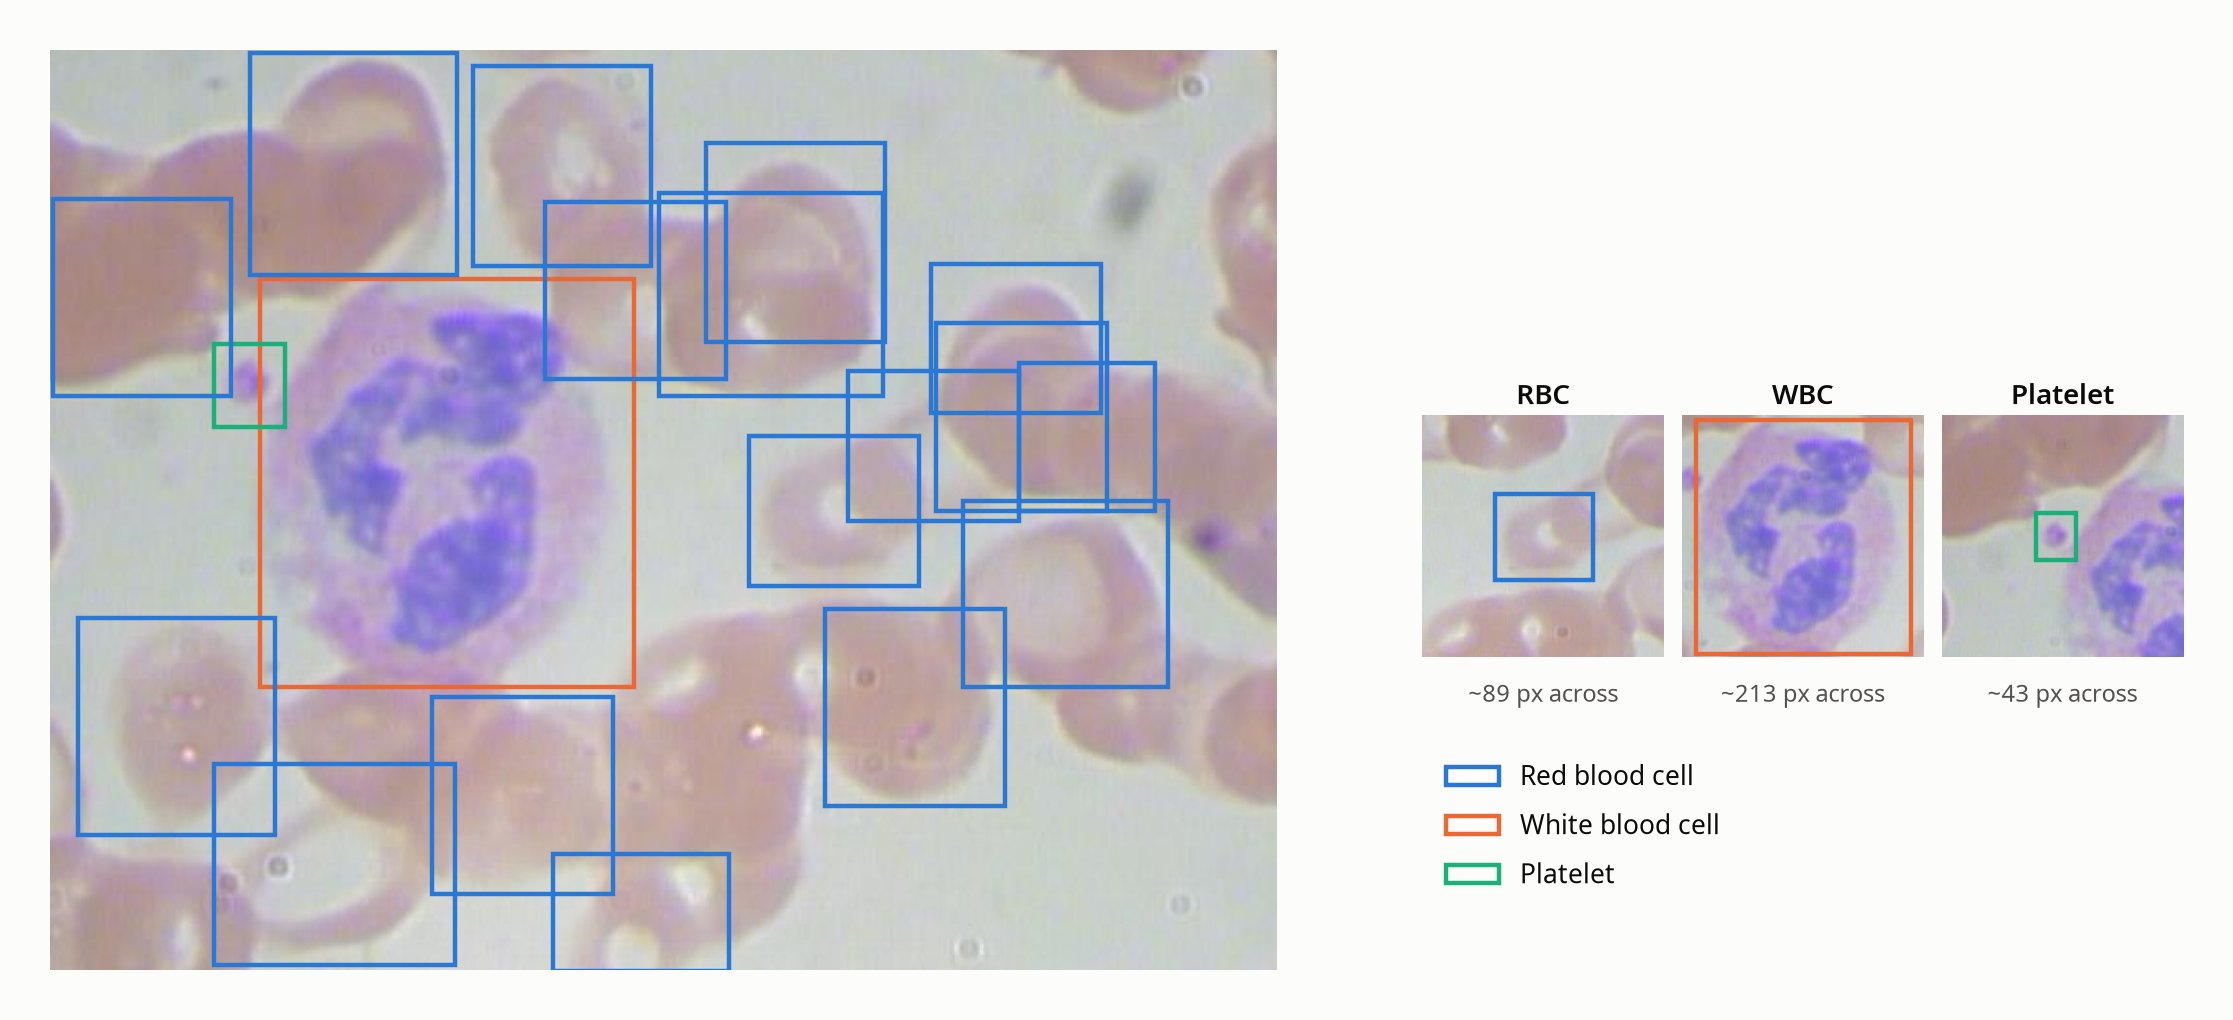
We used BCCD, a public dataset of microscope photos of stained blood smears with a box around every labeled cell, and kept its published split. A typical photo has a dozen red cells, almost always one white cell and a few platelets, at very different sizes. A blood smear has no “up”, so every training photo is learned flipped and mirrored too.
- Training · 205 photos
- 2,381 red cells, 214 white cells and 209 platelets, each photo learned in 32 flipped, shifted and rescaled versions
- Validation · 87 photos
- checked after each round of training, and used to set the detection threshold
- Test · 72 photos
- 805 red cells, 71 white cells and 69 platelets, kept aside until the very end
How we built it
Find the centers, count the peaks
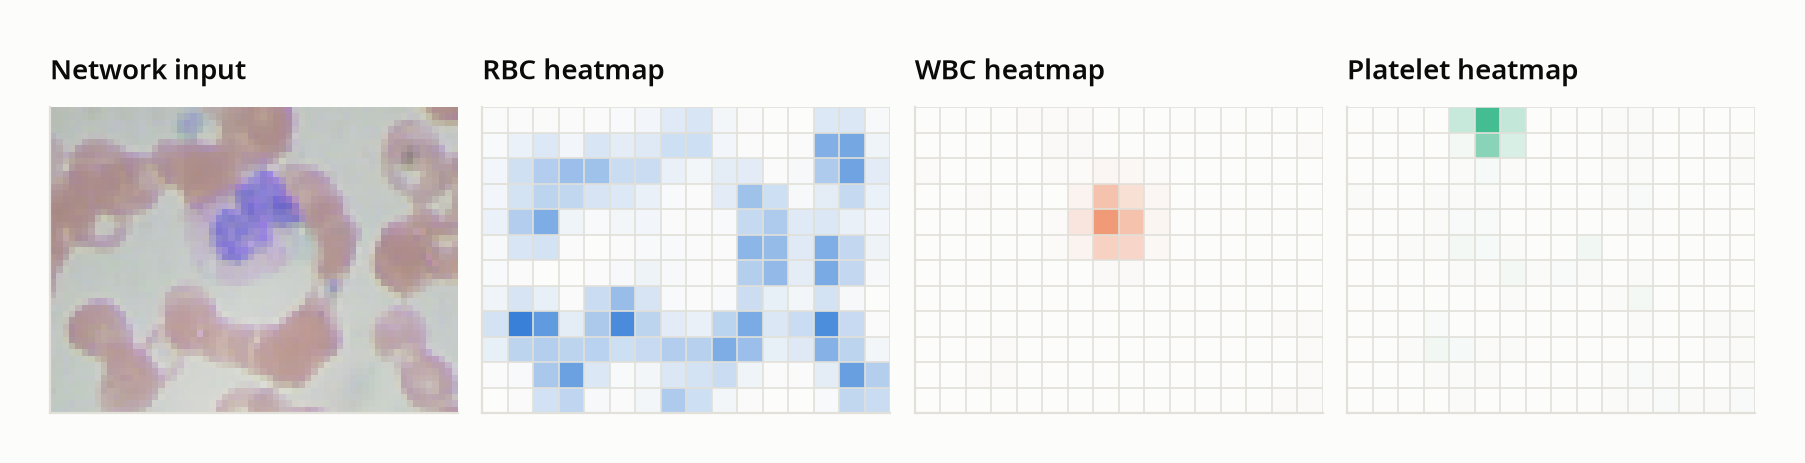
Big detectors predict a box around every object. We used the leaner approach small embedded detectors use and predict where each object’s center is. The network outputs one heatmap per cell type, every peak is one cell, and counting comes down to counting peaks.
- 01
Shrink the frame
The whole 640 × 480 camera frame is averaged down to 64 × 48 color pixels. No cropping: a detector has to see everything.
- 02
Detect
The network outputs three coarse 16 × 12 heatmaps, one each for red cells, white cells and platelets.
- 03
Count
Every peak above the threshold is one cell, with its position and a confidence score.

99 weights instead of 3.5 million. The last layer applies the same small classifier at every point on the grid. A fully-connected layer in its place would need 3.5 million weights, and this one needs 99. It also took no changes to our library at all.
Designed around the RAM. The first layer steps straight down to 32 × 24, so a full-resolution feature map never sits in memory. The usual layout would need about 70% more memory for the same accuracy.
Results
Every white cell found
We trained five models and scored each one on BCCD’s 72 test photos. All five found every one of the 71 labeled white cells, and across the test set they counted 807 red cells on average, against 805 labeled.
| Cell type | Precision | Recall | F1 | Counted (labeled) |
|---|---|---|---|---|
| Red cells | 77.2% | 77.3% | 77.2% | 807 (805) |
| White cells | 94.7% | 100% | 97.3% | 75 (71) |
| Platelets | 76.5% | 69.0% | 72.5% | 62 (69) |
Averages over the five trained models, scored against the dataset’s labeled boxes.
It found cells the labels missed
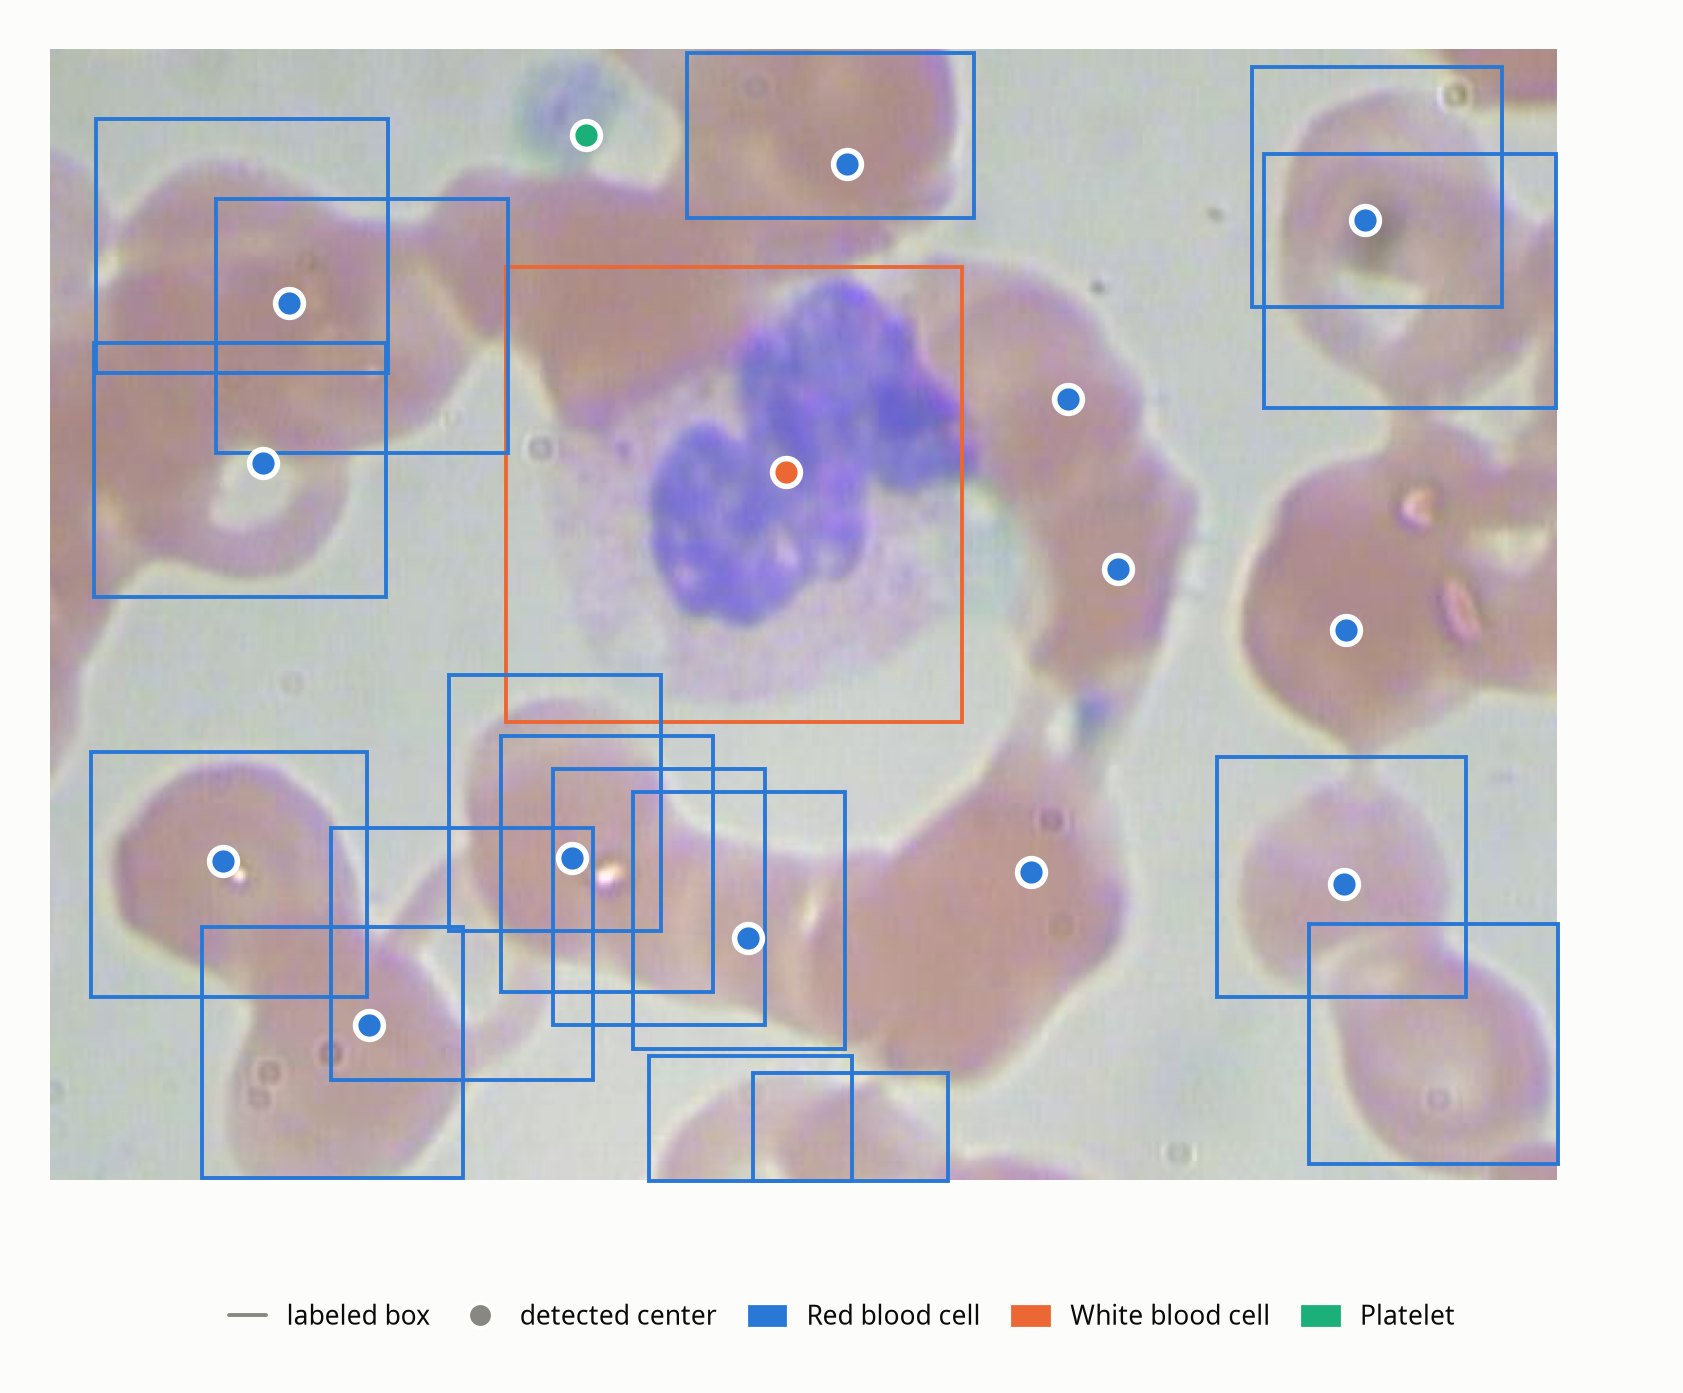
All five models made the same four extra white-cell detections, and every one is a real white cell the dataset’s labels miss. One is boxed as a platelet, and three have no box at all. Against what’s actually in the photos, every model found all 75 white cells and nothing else.
Red cells tell the same story. Three test photos have no red-cell labels at all, though each one is full of red cells, and other photos have unlabeled cells scattered through them.
On the device
23 KB of flash, about 270 KB of RAM
Quantized to 8-bit integers and exported in our zero-copy format, the detector takes 23,156 bytes of flash, and the smaller model gave up no measurable accuracy.
It runs in about 270 KB of RAM, which fits a microcontroller with 512 KB, at about 4 million multiply-adds per photo. The firmware runs the same three steps as training: shrink the frame, run the network, count the peaks.
- of flash for the 8-bit model
- 23,156 bytes
- of RAM while it runs, so a 512 KB part fits
- ~270 KB
- multiply-adds per photo
- 4.0 million
- weights in the output layer, where a fully-connected one would need 3.5 million
- 99
Blood smear photos from the BCCD dataset, used under the MIT license.
Ready to build your next intelligent device?
Let's discuss your project and how Cole Design & Development can bring your idea to life.
Founded in 2008 · Hudson, Ohio · info@coledd.com