
Image Classification
Telling a cat from a dog in an ordinary photo, on the microcontroller in a camera-equipped pet door. Our 25,042-parameter network learned from about 23,300 real pet photos, and the whole model fits in 36 KB of flash.
- average accuracy on a balanced set of held-out photos, over five runs
- 86.2%
- parameters in the whole network
- 25,042
- of flash for the 8-bit model, with no measurable loss in accuracy
- 36 KB
- cat and dog breeds, each measured on its own
- 37
Where it's used
A camera that decides for itself
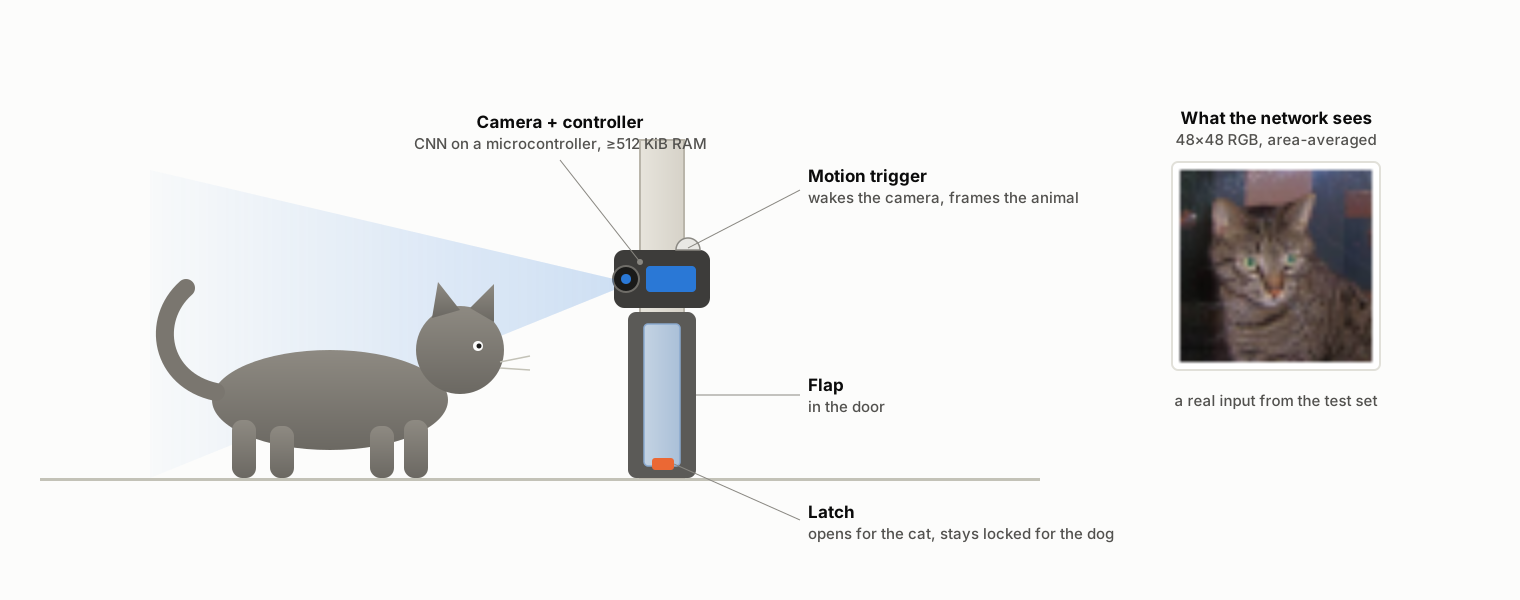
A camera-equipped pet door has to decide on the spot whether the animal in front of it is the cat it should let in or the dog it should keep out. There’s no time for a trip to the cloud between the animal arriving and the latch deciding, so the decision happens on the door’s own microcontroller.
And these aren’t tidy studio shots. They’re ordinary pet photos, on couches, on lawns and in people’s arms, which makes the job a lot harder than it sounds.
- A pet door that lets the cat in and keeps the dog out
- A feeder that only opens for the cat
- A camera that wakes when something approaches
- Decides on the spot, with no round trip to the cloud
The data
About 23,300 real pet photos
We trained on two public datasets together: Microsoft’s Kaggle Cats and Dogs, 25,000 shelter photos, and the Oxford-IIIT Pet dataset, about 7,400 photos of 37 breeds. Two test sets are kept aside, so we can measure it both overall and breed by breed.
- Training · 23,309 photos
- 11,068 cats and 12,241 dogs, each one also learned as its mirror image
- Validation · 2,868 photos
- checked after each round of training, so we keep the best model
- Balanced test · 2,500 photos
- 1,250 cats and 1,250 dogs, kept aside until the very end
- Breed test · 3,669 photos
- Oxford's own test set, with a breed name on every photo
How we built it
From camera frame to cat or dog
- 01
Find the animal
A motion detector says where it is. At a pet door, it fills most of the frame anyway.
- 02
Shrink it
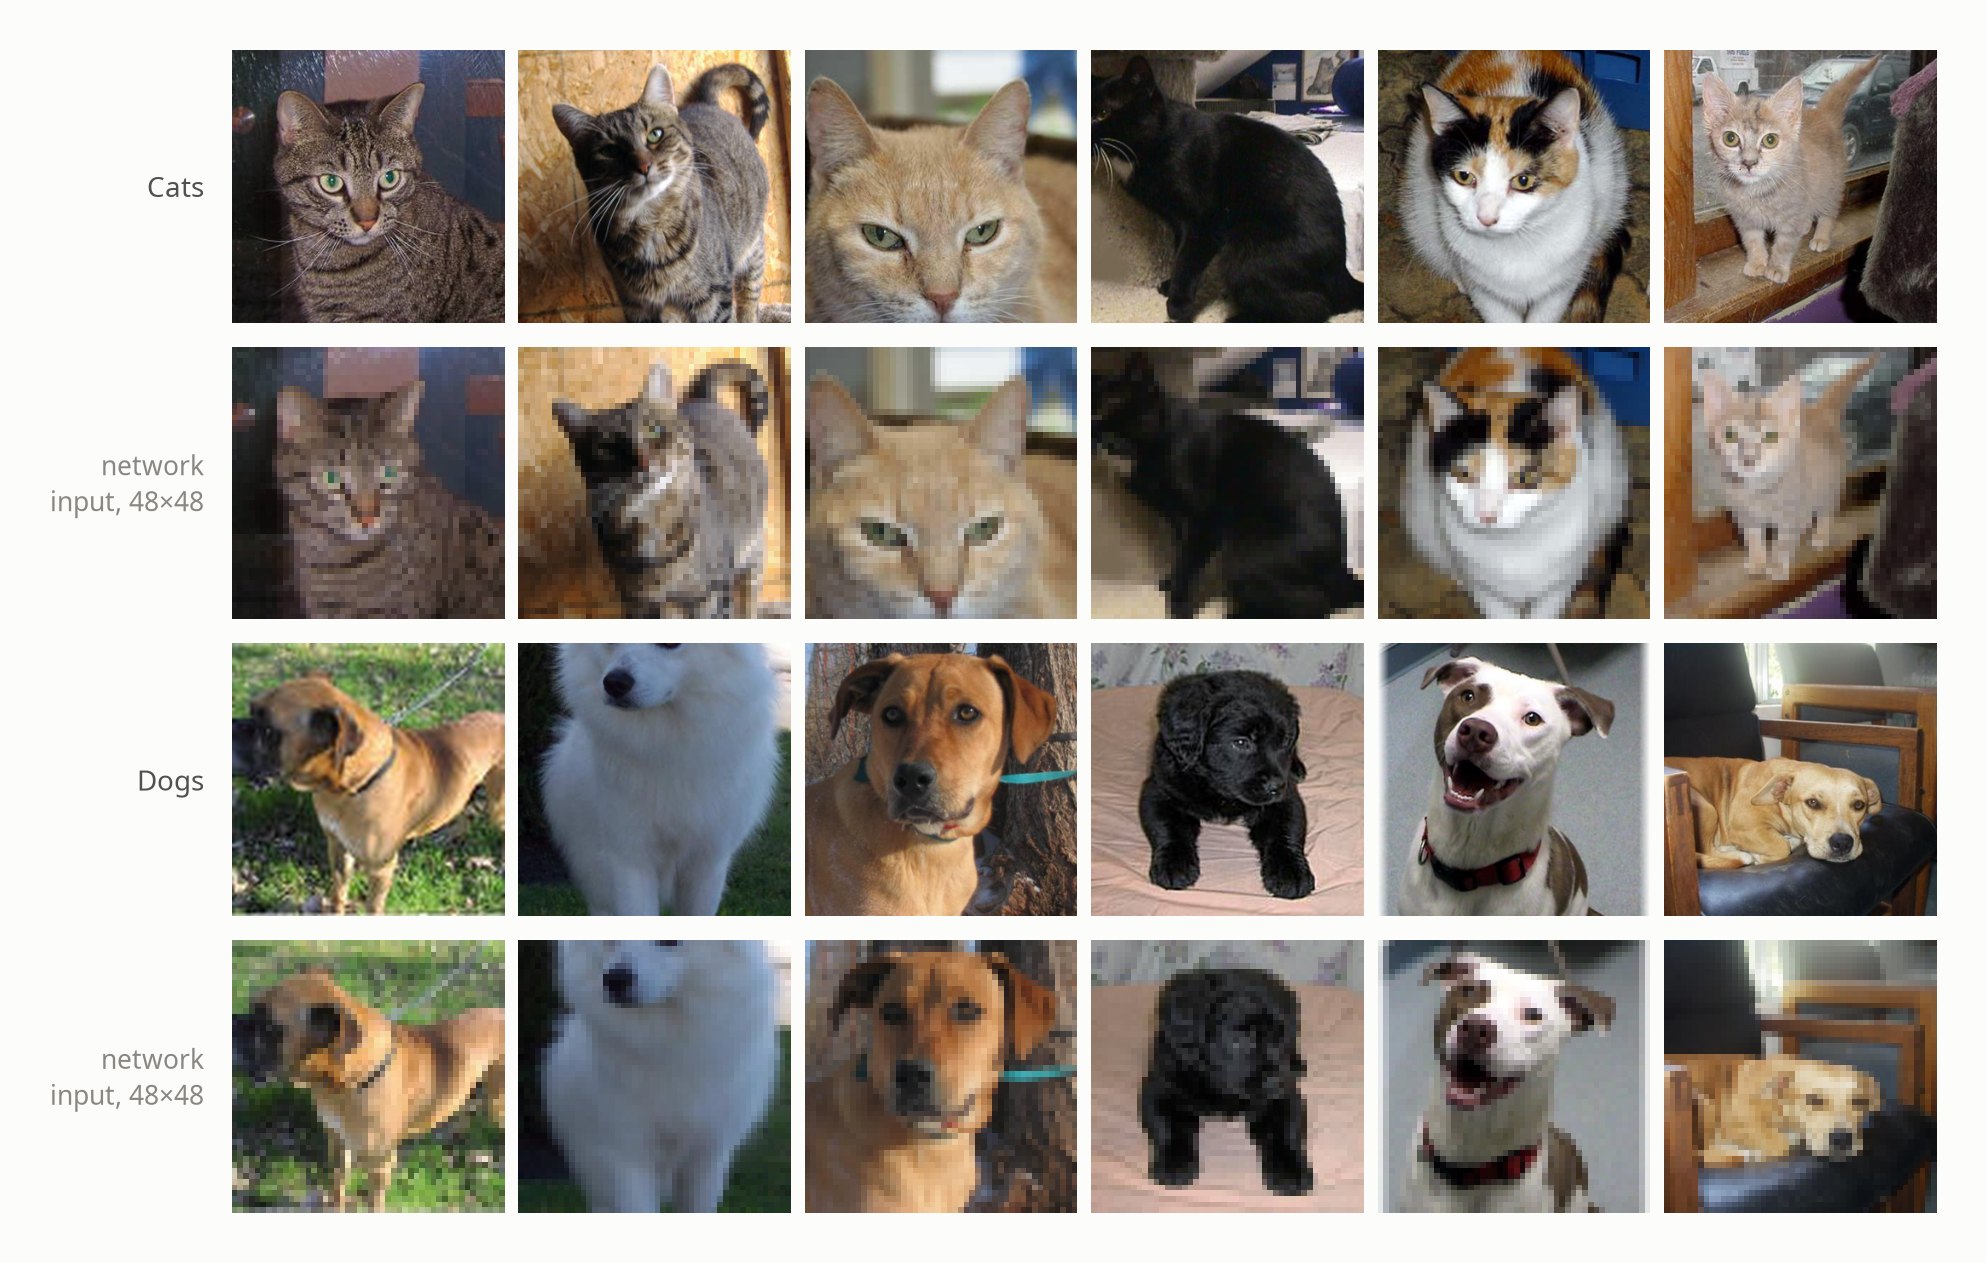
Crop a square, average it down to 48 × 48 color pixels and even out brightness. The device runs exactly the code that built the training data.
- 03
Classify
Four stages of convolution and pooling decide: cat or dog.

No big layer at the end. Global average pooling boils each of the 64 final feature maps down to one number. That keeps the network at 25,042 parameters, and it means the network cares about what’s in the picture rather than exactly where.
Every pixel counts. The photo is shrunk by averaging areas rather than skipping pixels, so the 48 × 48 image is a faithful thumbnail, and evening out brightness takes different cameras and lighting out of the picture.
Results
86% on everyday pet photos
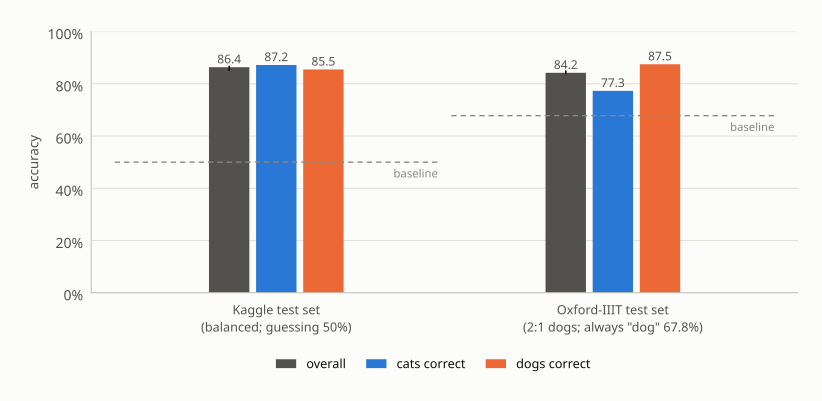
Over five training runs, the network scored 85.2 to 86.7% on the balanced test set, 86.2% on average, and 84.4% on average on Oxford’s test set, where the cats and dogs are spread across 37 breeds.
Two test sets, two questions
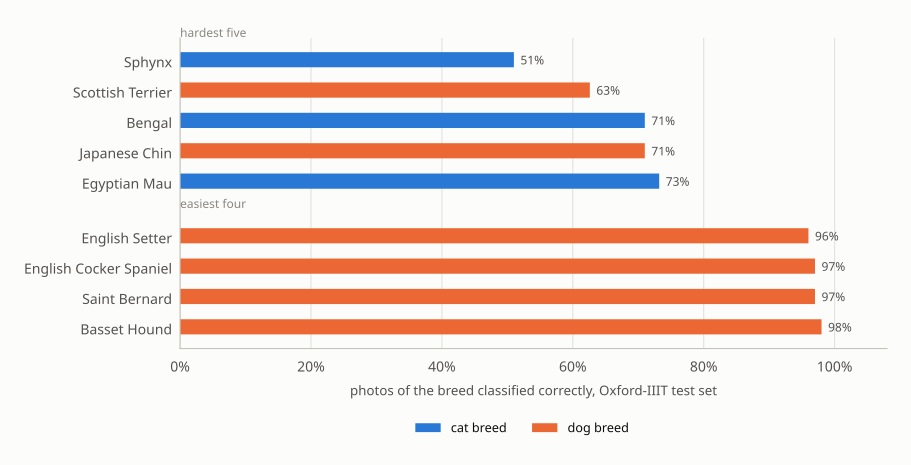
The balanced set shows how it handles more photos like the ones it learned from. In the run charted here it got 87.2% of the cats and 85.5% of the dogs right. Oxford’s set puts a breed name on every photo, so it shows exactly which animals are hardest to tell apart.
The hard cases are the ones you’d expect
Hairless Sphynx cats, spotted Bengals and slender Egyptian Maus are the trickiest cats, and small or fluffy dogs like Scottish Terriers and Japanese Chins the trickiest dogs. Big hounds, setters and spaniels are close to perfect, with Basset Hounds at 98% and Saint Bernards and English Cocker Spaniels at 97%.
On the device
Down to 36 KB, with no measurable loss
Quantized to 8-bit integers and exported in our zero-copy format, the whole model takes 36,244 bytes of flash. The smaller model gave up no measurable accuracy: 86.28% on the balanced test, against 86.36% at full precision.
While it runs it needs about 340 KB of RAM, which fits a microcontroller with 512 KB, and each photo takes about 3.4 million multiply-adds.
Have more memory to spare? Spend it on accuracy. A 64 × 64 input reached 87.2%, and doubling every stage’s filters reached 88.1%, with about 600 to 680 KB of working memory.
- of flash for the 8-bit model
- 36,244 bytes
- of RAM while it runs, so a 512 KB part fits
- ~340 KB
- multiply-adds per photo
- 3.4 million
- on the balanced test with every stage's filters doubled, if RAM allows
- 88.1%
Pet photos from Microsoft’s Kaggle Cats and Dogs dataset, used under the CDLA-Permissive 2.0 license.
Ready to build your next intelligent device?
Let's discuss your project and how Cole Design & Development can bring your idea to life.
Founded in 2008 · Hudson, Ohio · info@coledd.com